Analysis of YC's Latest S24 Batch
It’s the week of Y Combinator’s Demo Day — a rare week when it seems like every investor’s attention and time are focused on the same thing, the latest batch of super-geniuses to go through the program.
It was Garry Tan’s second batch after returning to YC last January, and the third one since the start of the AI/ML boom.
It will also be the final cohort to participate in the “two batches a year” model; starting in 2025, YC is moving to a quarterly schedule and batches will be about half the size. This was a big announcement since the “Winter” and “Summer” has been the standard.
I always find the aggregate batch data interesting — it’s a snapshot of industry trends, a high-level overview of what founders and investors are thinking about.
I received positive feedback on the analysis I did for the last batch (Analysis of YC's Latest W24 Batch) —
So I thought, let’s run it back; the report below is an analysis on YC’s S24 batch.
Key takeaways
YC’s latest S24 batch includes 255 companies.
67% of companies in the batch are categorized as “AI.”
Over half (55%) of the companies include a founder with a Master's or Ph.D.
72% include a founder with a computer science background.
Most companies (54%) have two co-founders.
67% are based in San Francisco.
Around half (48%) of companies have at least one second-time founder.
Spreadsheet of all companies
In case you want to dive into the data yourself and prefer spreadsheets rather than the YC website —
Here is a spreadsheet of all the companies in this bach, collected directly from the YC site:
https://docs.google.com/spreadsheets/d/1Uy2aWoeRZopMIaXXxY2EZqQ-p1XkybYp21llKCfLsME/edit?gid=0#gid=0
Batch Size
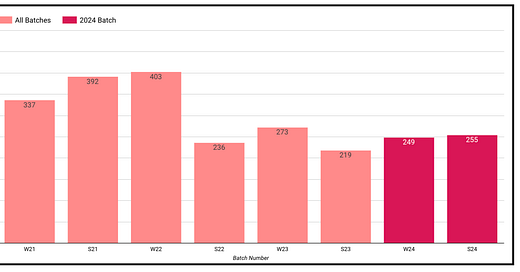
The chart below shows the number of companies in each batch. We can see that this batch, Summer 2024, is similar size to last Winter’s with 255 companies participating.
Category Breakdown
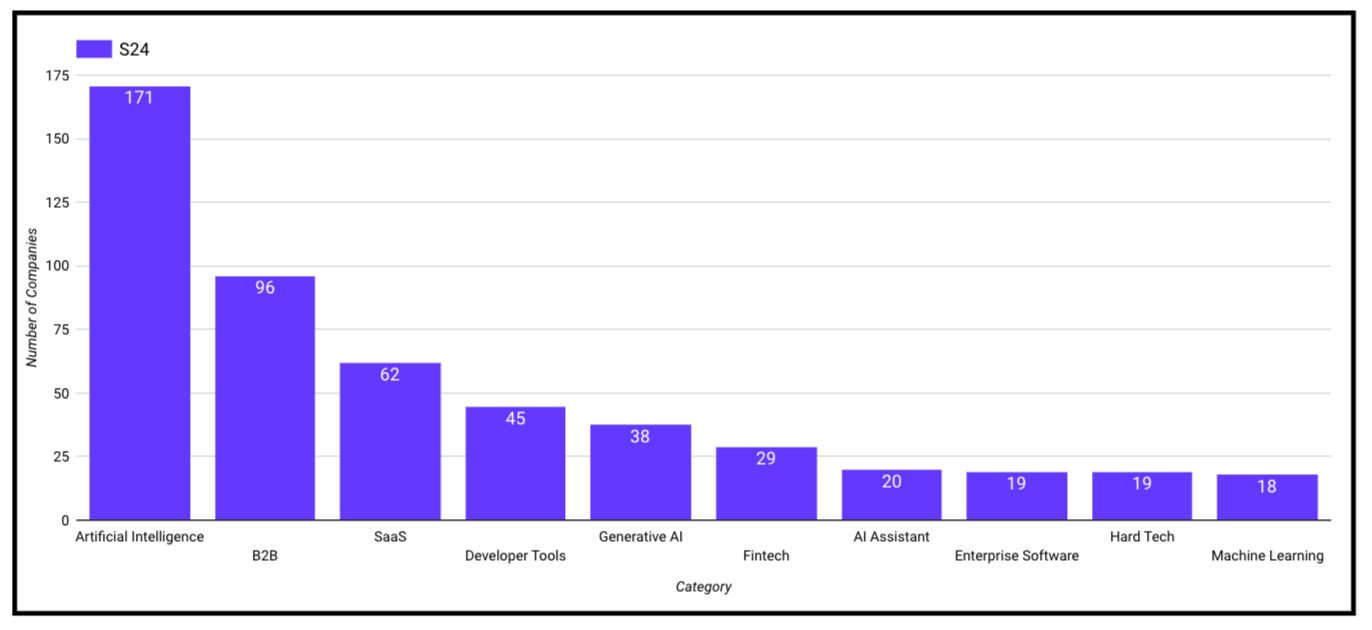
Not surprising, “AI” is the most prominent category. 67% of companies in the batch are AI.
Percentage of batch “AI” companies over time
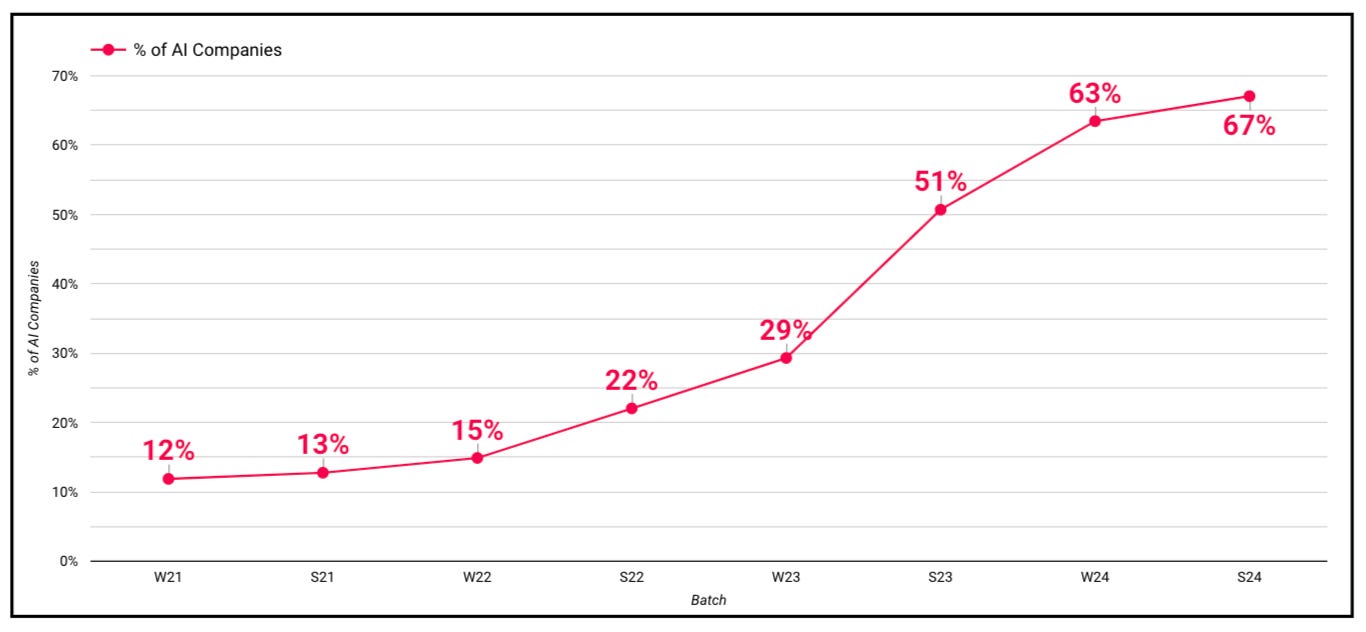
Below, shows the percentage of “AI” companies over time. Notably, 67% of companies in the current batch are classified as "AI," but just two years around, it was only 15%.
Of course, the caveat here is that “AI” has been popularized as a category name. So a lot of companies who were using AI/ML techniques in the past, may not have been explicitly categorized as "AI."
However, the graph clearly demonstrates the dominance of "AI" companies in the current batch.
Founding team size
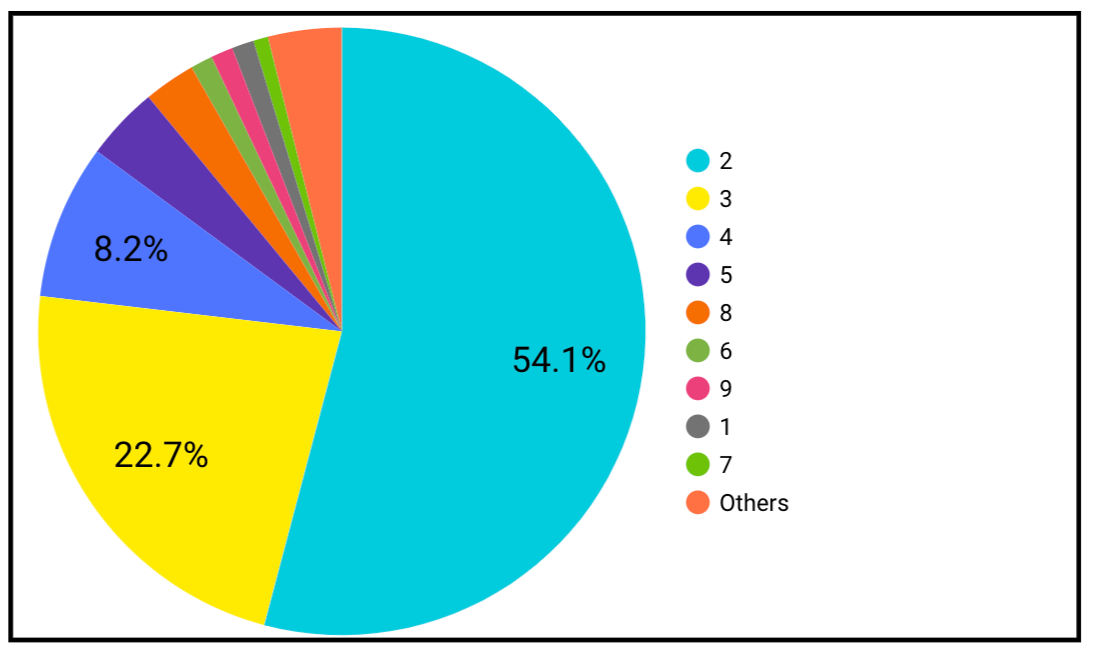
The pie chart below shows the distribution of team sizes among the S24 batch.
The predominant team size is two co-founders, which makes up 54% of the companies. Teams of three founders account for 23% of the total, while various other team sizes collectively make up the other 23% of the batch.
This data is no surprise — historical data shows that co-founder pairs outperform solo founders.
Degrees and higher education
YC biases towards companies whose founders:
Attended top schools
Hold advanced degrees
Include at least one technical founder.
Here’s a summary of the data on the educational backgrounds of the founders:
55% of companies (142 in total) have a team member with a higher education degree.
48% of companies (109 in total) include at least one member with a Master's degree.
15% of companies (33 in total) include at least one member with a Ph.D.
11% of companies (25 in total) include at least one MBA on their team.
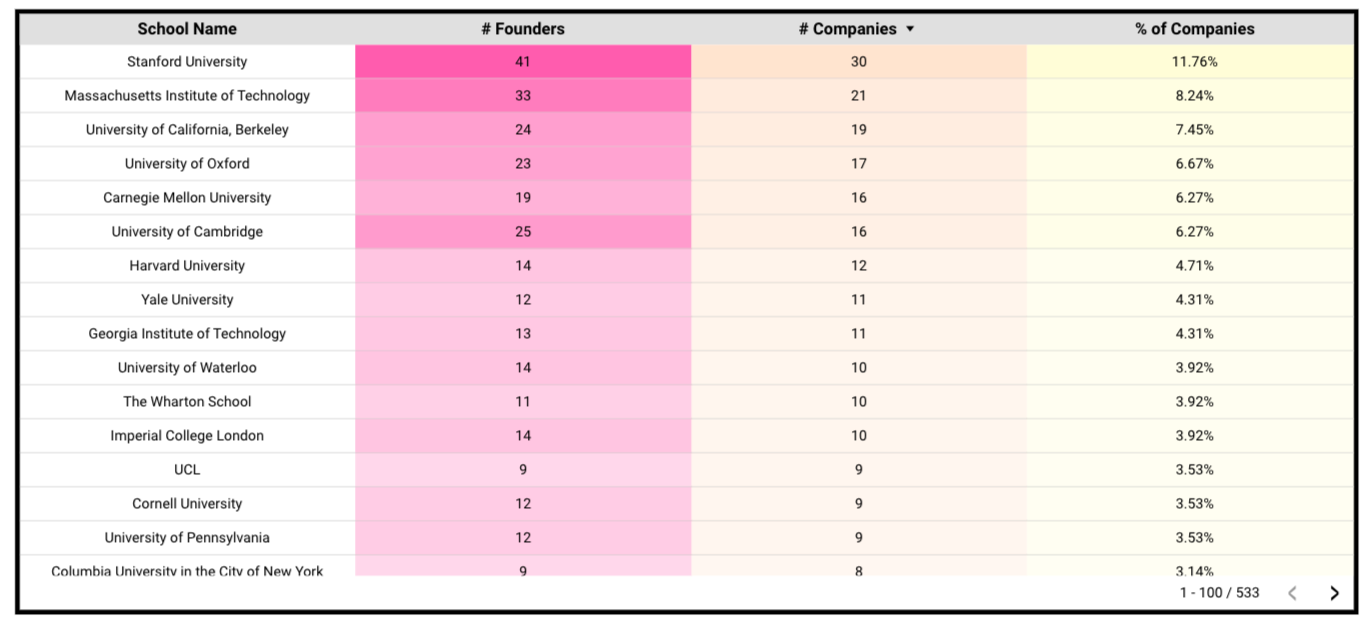
Alumni from Stanford and MIT represent 11% and 8% of the batch, respectively.
72% (185 in total), have a member with a degree in computer science.
Location
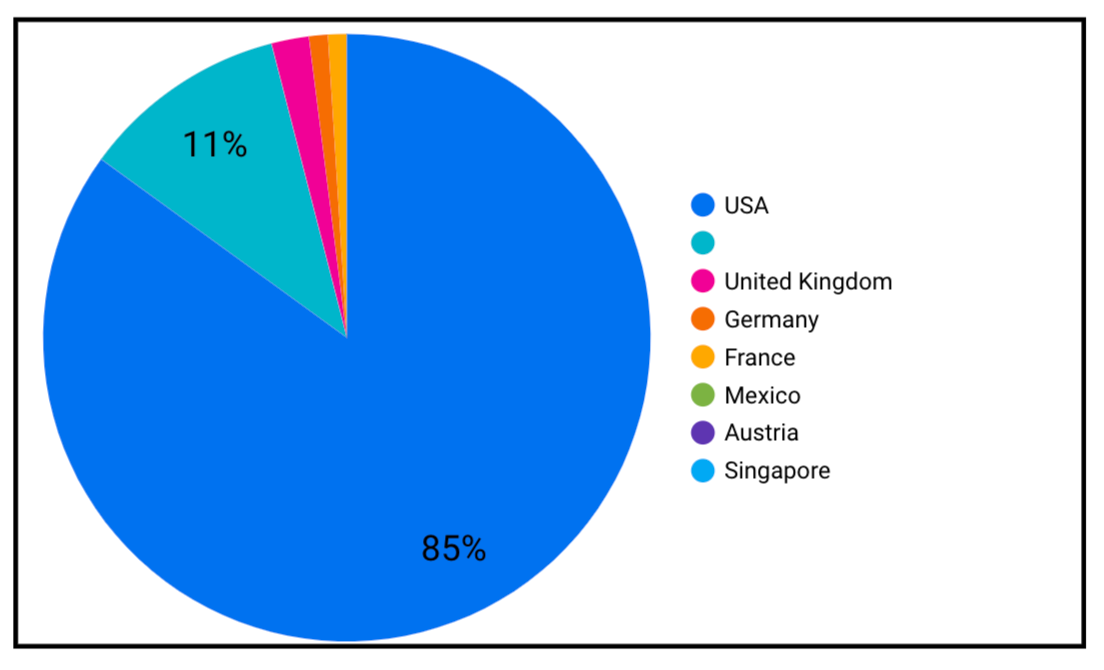
Most of the companies are based in the US. The second biggest category is companies that don’t have a listed location.
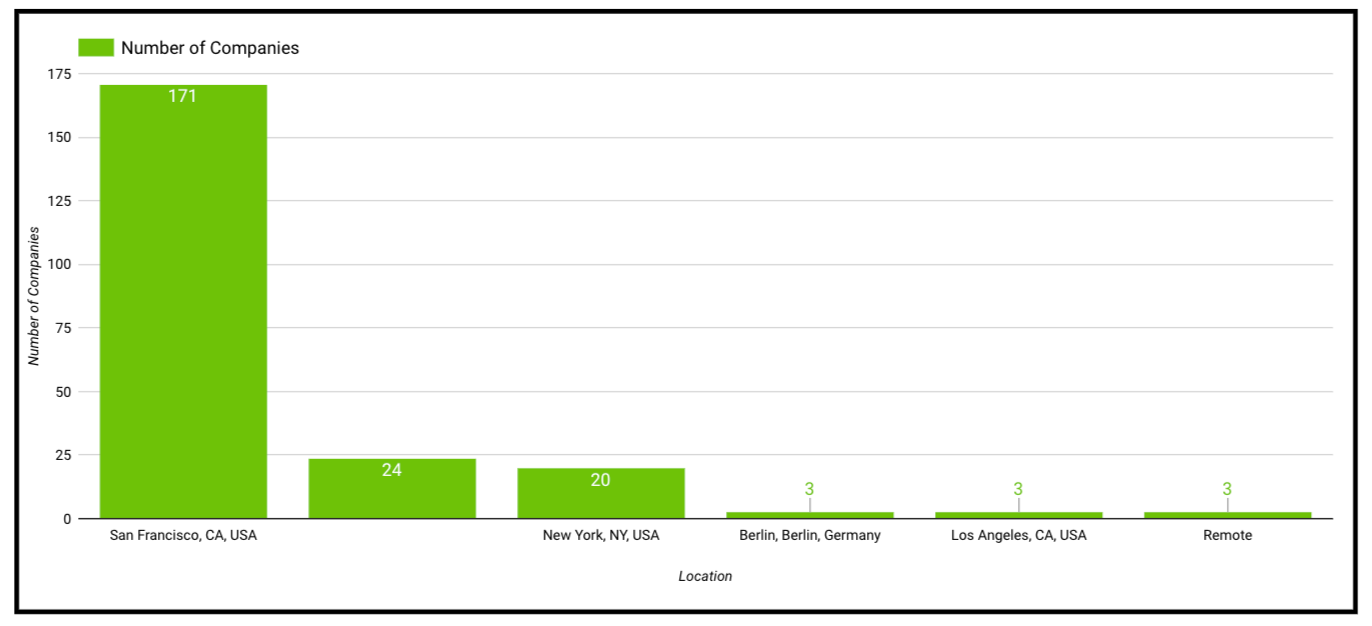
Not surprisingly — San Francisco continues to be the predominant location, representing 67% of companies, up from 58% in the Winter 2024 batch.
Previous work experience & second time founders
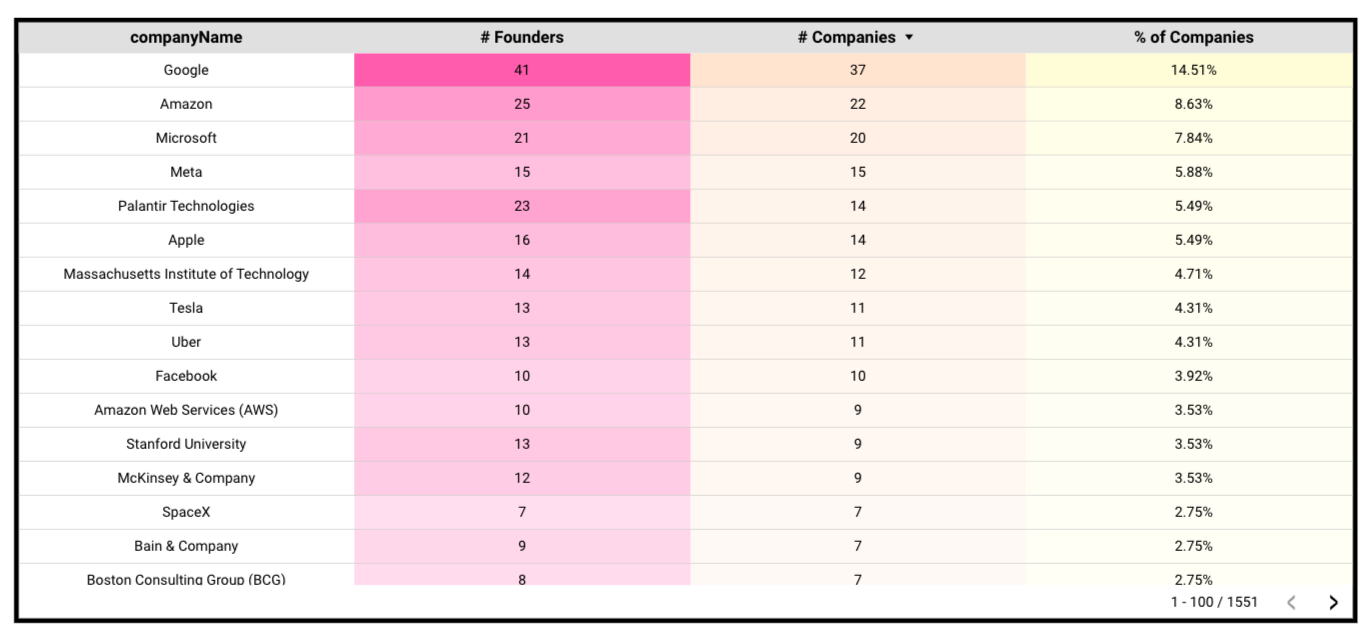
The table below provides a breakdown of companies where founders have previously worked. Consistent with expectations, the largest proportion of founders have experience at FAANG (Facebook, Amazon, Apple, Netflix, Google) companies.
I also found that 48% of companies have at least one second-time founder. The second time founder data isn’t perfect, but directionally right.
Outro
Thank you for reading! Good luck to all founders presenting during Demo Day!
I’m an investor at Chapter One, an early-stage venture fund that invests $500K - $1.5M checks into pre-seed and seed-stage startups.
If you have any questions on the data, or if you’re a founder building a company, please feel free to reach out on Twitter (@seidtweets) or Linkedin (https://www.linkedin.com/in/jamesin-seidel-5325b147/).

